

What is the P50 runtime of your unit test workflow? How frequently do your hourly jobs fail? How has the performance of your release workflow changed over the last 3 months?
These are all questions that you should be able to answer and now you can, easily, with Trunk CI Analytics.
Today we are announcing the public availability of Trunk CI Analytics. With this product launch, we are pulling back the curtain on the CI black box. Without actionable intelligence, your DevOps and engineering teams are left in the dark. Trunk CI Analytics shines a giant spotlight on the problematic hot spots in your CI workflows, with beautifully rendered trend lines, anomaly alerting, and the ability to perform deep historical analysis with just a few clicks.
An engineering team is only as efficient as its most flaky and longest-running CI job. Your suspicions around the system degradation that seems to have crept in over the last month is now brought to you in brilliant technicolor so you can pinpoint the exact commit that introduced that 31% increase in testing runtime.
Build/Test Intelligence
To really understand why your engineering efforts keep missing deadlines, you need to understand what the real process bottlenecks are in your engineering workflows. The root cause of engineering inefficiency can often be traced back to broken engineering workflows, not the talents of your engineering team.
While the market is littered with Engineering Intelligence solutions that focus on the “productivity” of people. Engineers cannot (and don’t want to be measured) by the number of lines they’re committing, the amount of time spent on a particular pull request, or any of the other quasi-metrics that are now popular.
Our goal at trunk has always been to level up your entire engineering organization. We believe that a rising tide lifts all ships and a more efficient engineering organization can build faster and better. Whether you are a “10x engineer” or a coding boot-camp new grad, your ability to land code on main is dependent on the same CI system. The same slow test workflows and flaky/unreliable jobs are bottlenecks for your entire engineering organization. With CI Analytics your entire team is empowered to see what’s broken and deliver force-multiplying fixes.
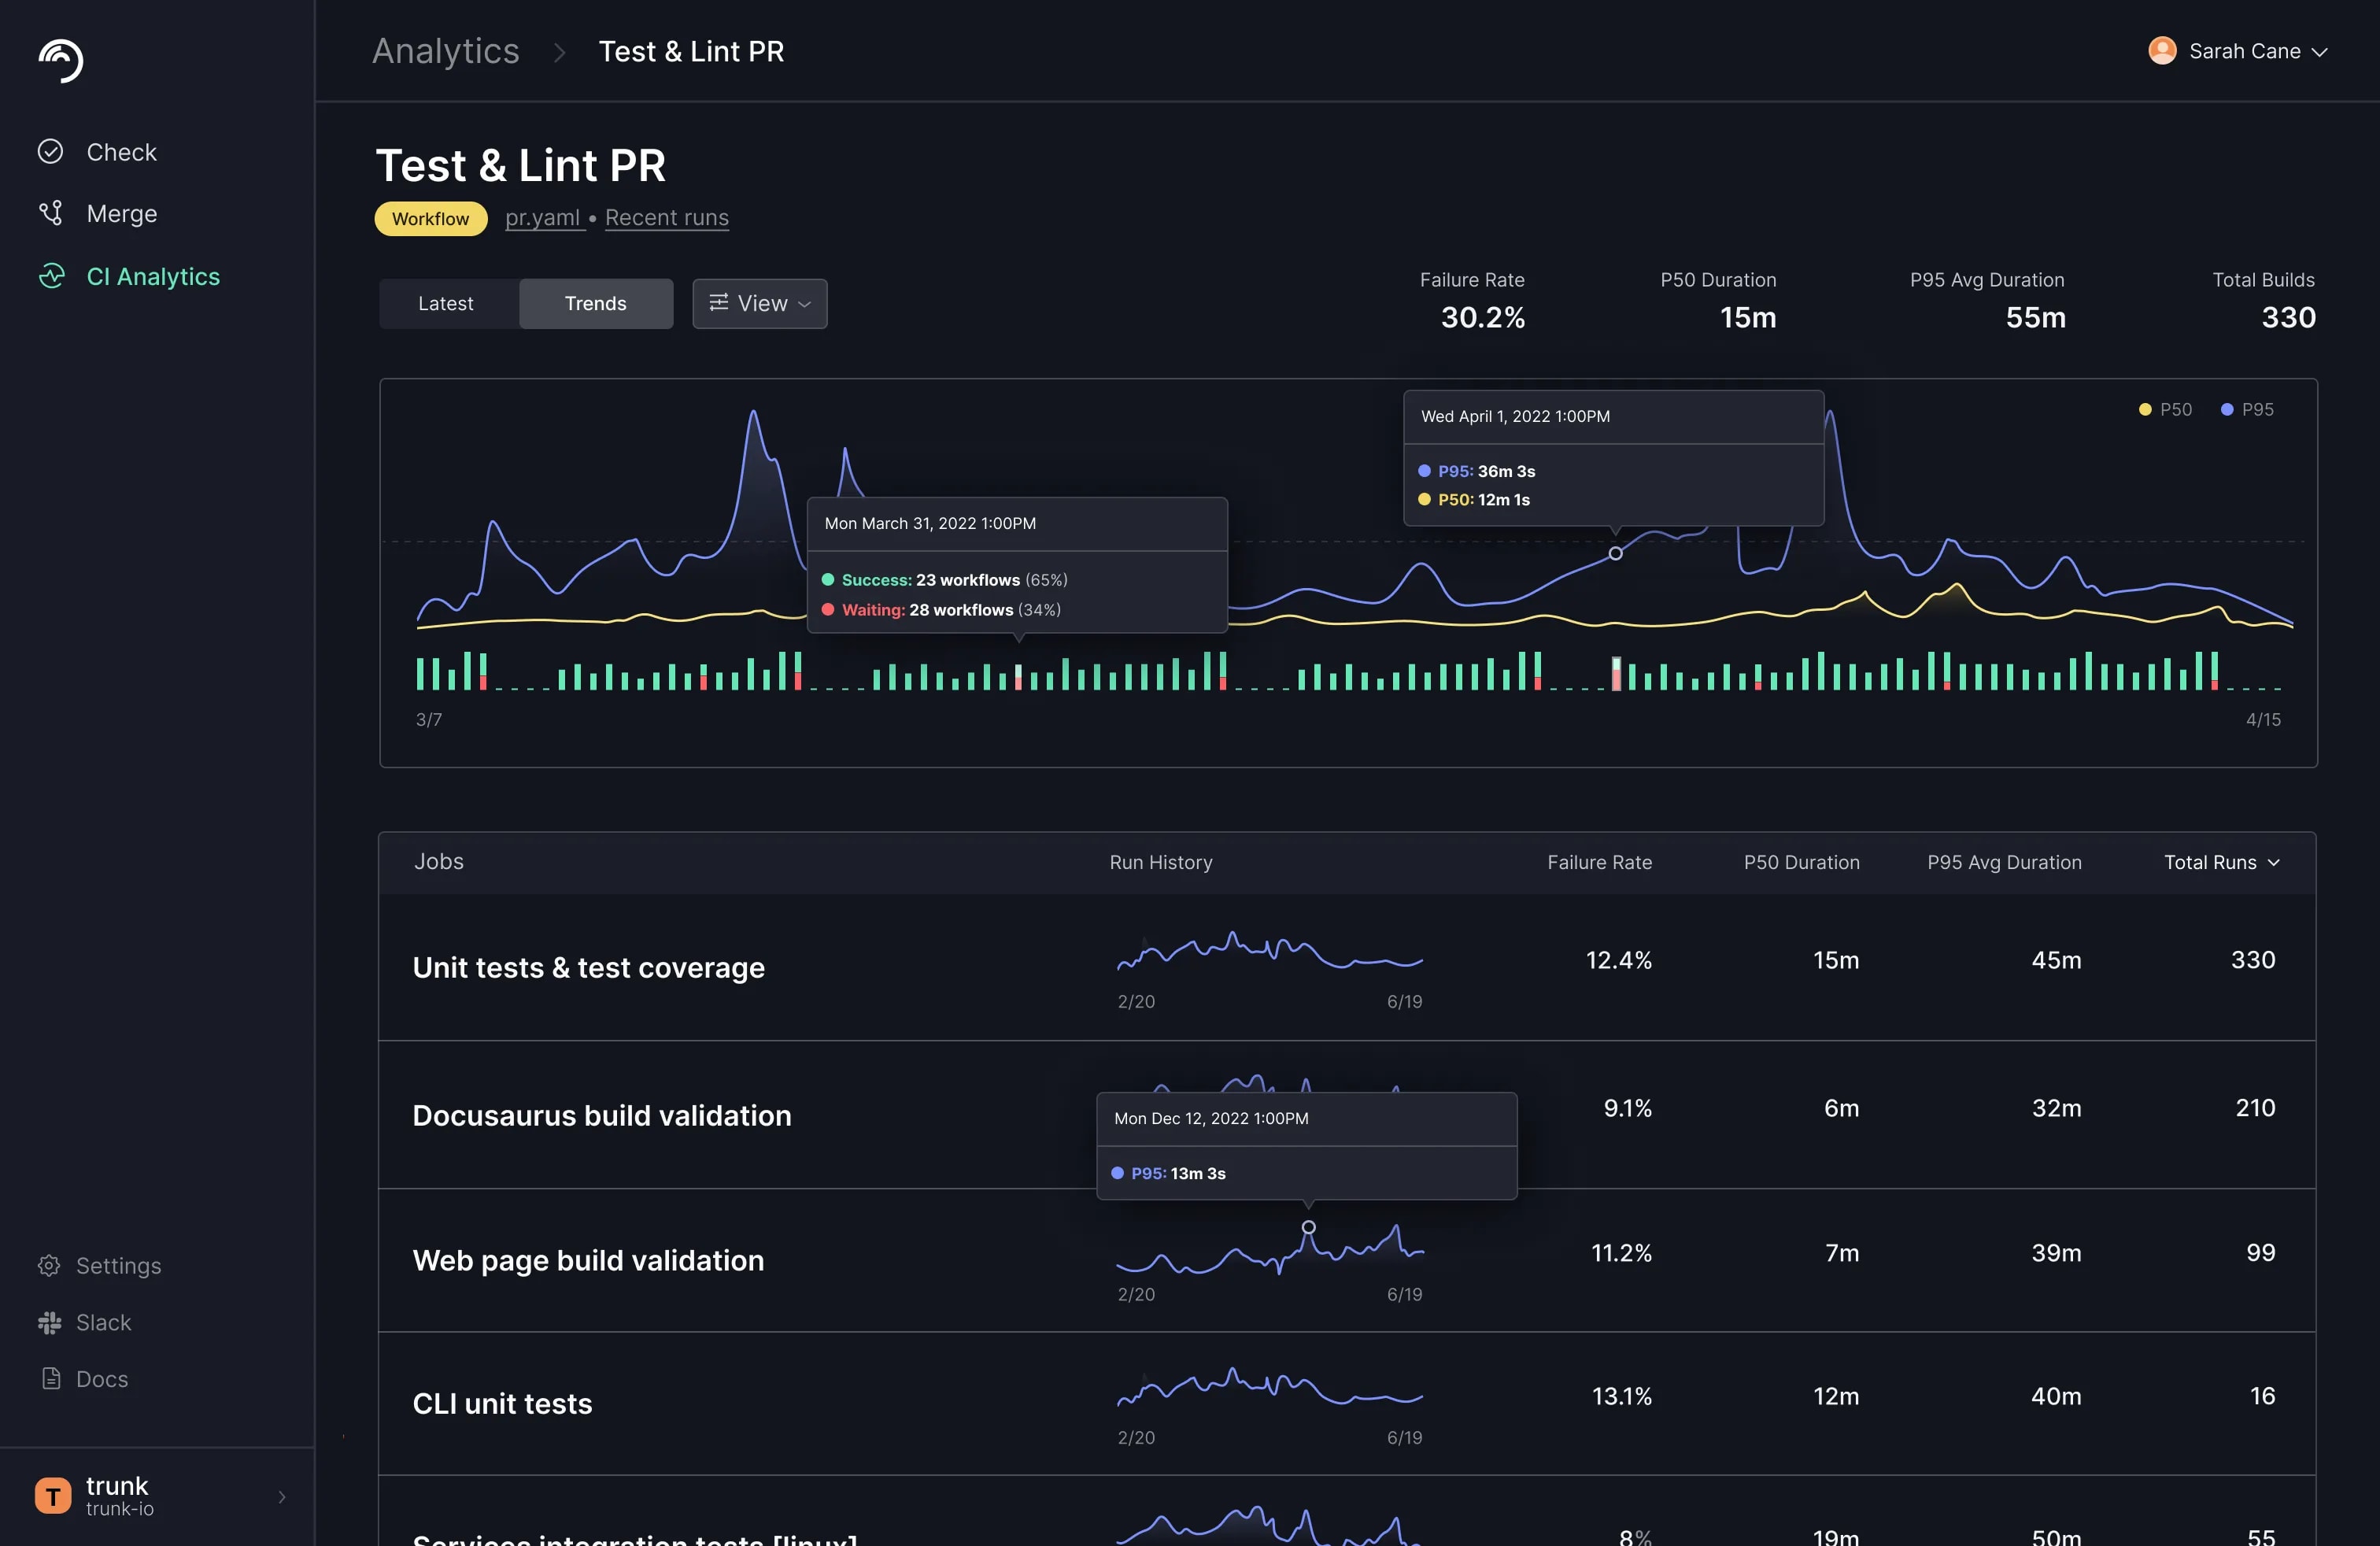
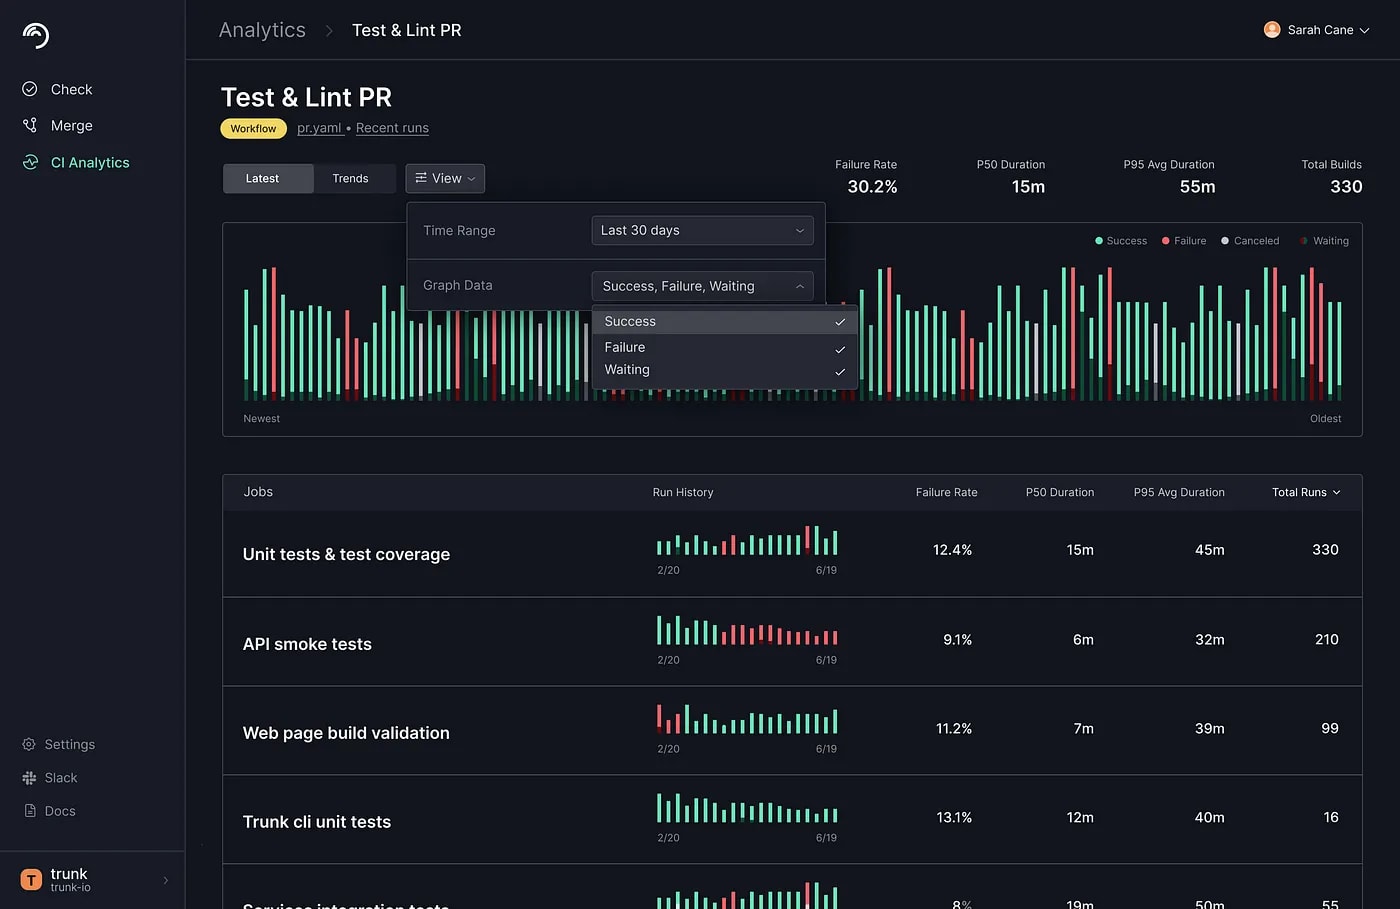
Trunk CI Analytics provides a complete picture of all your GitHub Actions. By providing both recent and historical views of your workflows. You get a clear picture of everything running in CI; you can easily validate which pieces of your overall CI system are healthy and which are in need of a tune-up.
Some common learnings might be which workflows are consuming the most machine time, how frequently are they run, and how often they are failing. Operating without this level of engineering intelligence can be the difference between shipping code on time and slowly grinding to a halt.
Green doesn’t always mean Green
In many ways, CI systems are a victim of their own success. Engineers have become overly confident in the clarity-to-land provided by a green board of CI actions; there is, however, a far more important story to be told in the details of how and when a set of CI jobs are run. Just because a set of unit/integration tests pass — doesn’t necessarily mean it is ok to land that pull request. What if that pull request is introducing a performance degradation that is causing your unit tests to double in execution time?
It is very hard for any individual engineer to keep tabs on the performance aspect of every job in the system, or to run proper experiments to understand how for example, more dedicated cores/RAM will actually impact the real-world performance of your jobs. These are questions best answered with visual dashboards and performance charting that can clearly articulate the story and health of your CI system.
Deep dive into every step of your jobs
The Trunk CI Analytics landing page provides a 10,000-foot view of your CI system. Once you’ve identified a workflow with a flaky execution pattern or erratic timing, you can easily drill in to get a fuller picture of where that time is being spent, which job, and which step in that job is causing the workflow to degrade. The same level of powerful charting and tabular data is available as you dive deeper into the workflow. Every job and step is laid bare, and it is almost too easy to find the lagging element. Now you don’t have to go hunting for that needle in the haystack — it's right there, lit up like a Christmas tree.
Get started in minutes
Trunk CI Analytics is self-service and available starting today for GitHub Actions. All users receive two weeks free, and the cost is $7 a month per user thereafter. We’d love to have you try it out (no credit card required) and let us know what insights it turns up for your organization. To get started, visit: https://trunk.io/products/ci-analytics


