
Last week I was heads-down on a new feature for our Chrome extension. Normal loop: make a change, run the tests, wait for the green check, move on. Except the waiting part kept getting longer. And longer.
A test was failing. But instead of failing fast and telling me, it was hanging for a full minute before giving up. Then retrying. Then hanging again.
Timeouts, like taxes, only ever go in one direction
Here's the thing about test timeouts. They only ever ratchet up.
Nobody has ever, in the history of software, opened a PR that lowers a timeout. Think about the incentives. A flaky test fails in CI. You didn't write it, you don't have time to debug it, and you just want your build to go green. So you bump the timeout from 10s to 30s. Merged. Problem "solved."
Six months later someone bumps it again. Then again. The number creeps upward forever because raising it always makes the immediate pain go away, and lowering it risks introducing flake that lands on your desk. So the timeout becomes a one-way ratchet, completely disconnected from how long the test actually needs.
This is worst in Playwright and other UI automation suites. Those tests are genuinely slow. You're spinning up a real browser, hitting a real backend, waiting on real network calls. Long timeouts feel reasonable because the whole thing is heavyweight. So the built-in defaults, even before any ratcheting, tend to be pretty high in real wall-clock time.
The math of twiddling your thumbs
Now add retries, because these same suites almost always retry on failure. It makes sense in isolation. UI tests flake, retries paper over the flake, builds stay green.
But watch what happens when a test is actually broken.
It runs. It hangs until it hits the timeout. It fails. The runner shrugs and retries. It hangs until the timeout again. Fails again. Retries again. You've now burned three or four full timeout windows to learn a single fact: this test is red.
If the timeout is 60 seconds and you retry three times, that's three minutes of pure waiting to get told what could have been obvious in two seconds. Multiply that across every engineer, every push, every day.
The data was sitting right there
Here's what bugged me most while I waited. We already know how long this test is supposed to take. We have the receipts.
Every test in our system has history provided by our Test Intelligence product. Ninety days of it. We know that this specific test, at p95, passes in two seconds. Not "usually fast." Provably fast, ninety-fifth percentile, backed by thousands of runs. Thousands of confirmed passes, every one under two seconds. So why were we waiting sixty before timing out?
The test didn't need sixty seconds to know it had failed. It needed two. It just wasn't allowed to say so.
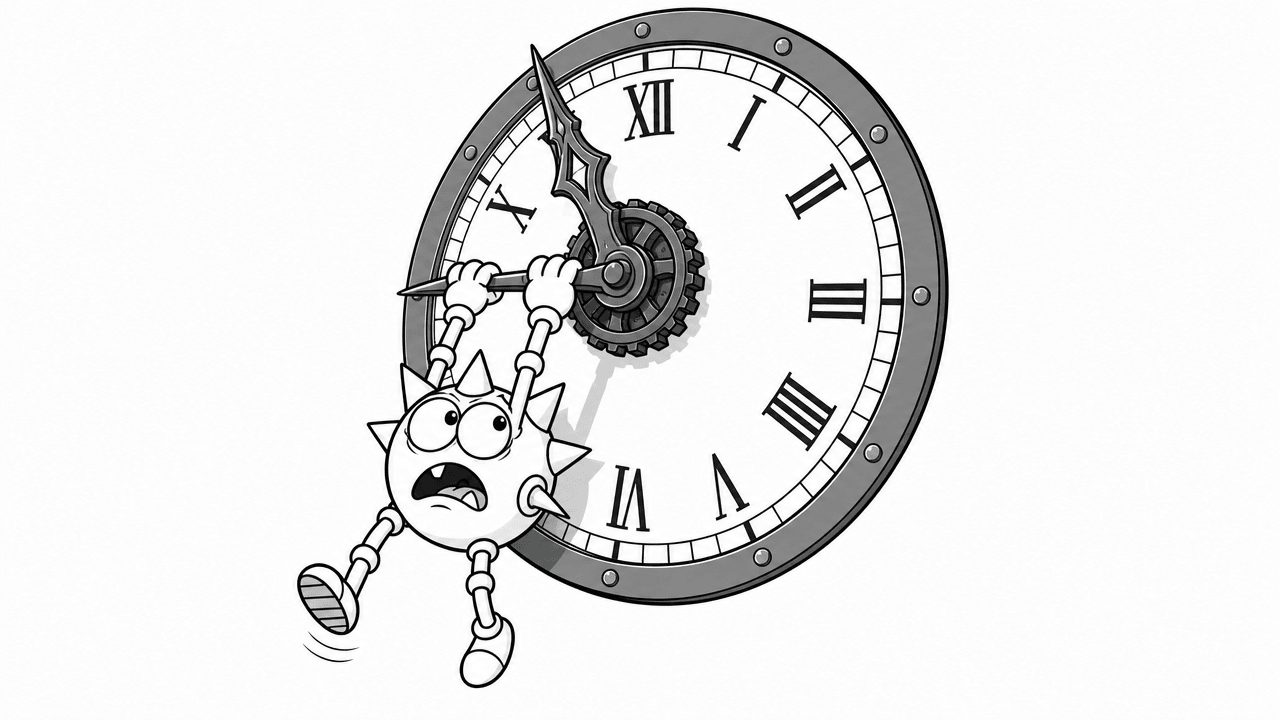
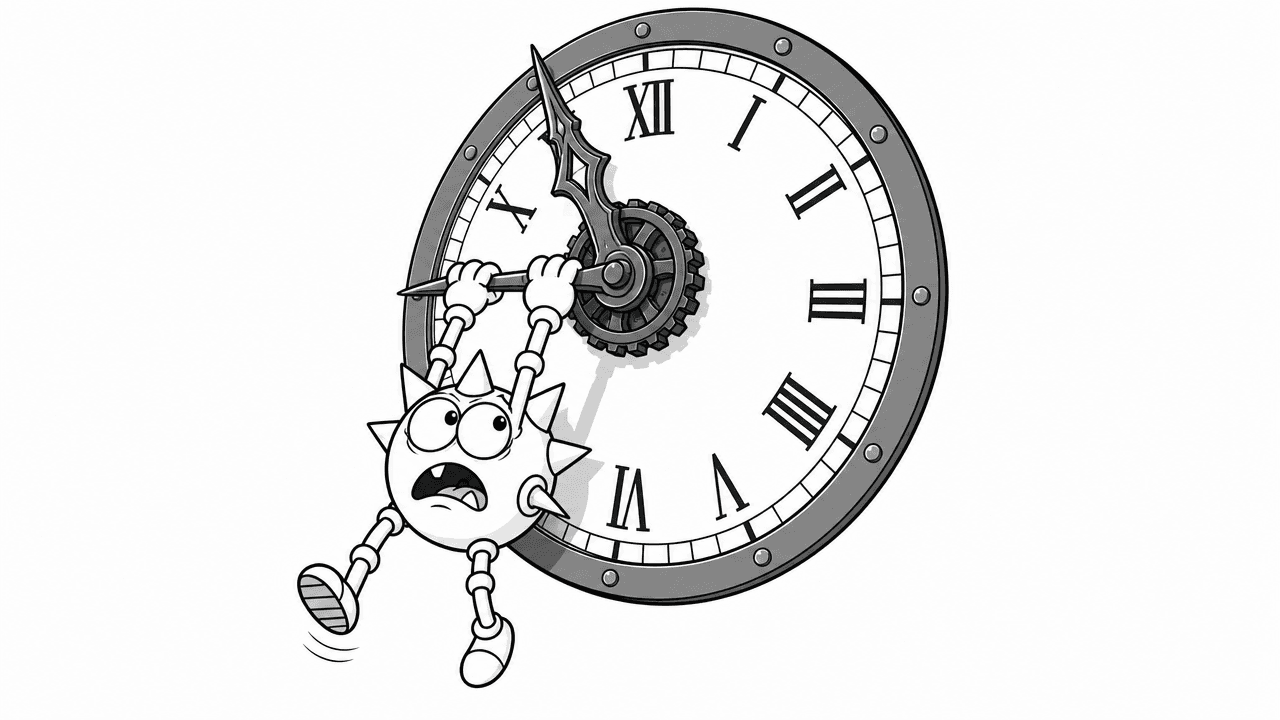
That gap is the whole insight. When a test passes in two seconds but fails in sixty, the sixty isn't giving the test some extra burst of time so it can finally pass, like the little engine that could. The test was dead from the start. We were just waiting sixty seconds to call it. It's not the test working hard. It's the test waiting for permission to die.
Introducing the Timeout Inflation monitor
So we built a monitor for it. The logic is stupid-simple once you see it.
Take a test's passing time at p95. That's your realistic upper bound on how long a healthy run needs. Then take its failure time at p50, the typical case when the test goes red. Compare the two.
If failures are landing way above the slowest passes, the test isn't doing real work when it fails. It's inflating against a timeout ceiling. A test that passes in 2s at p95 but fails at 60s at p50 isn't slow. It's stuck behind a timeout that's thirty times larger than it ever needs to be.
We flag that gap. That's a Timeout Inflation case, and now we can go find every one of them across a whole test suite instead of stumbling into them one frustrated afternoon at a time.
The data was always there. Nobody was looking at the two numbers side by side.
Here's it catching a real one
This isn't a thought experiment. Here's the monitor doing exactly this on a real Playwright test in one of our own repos.
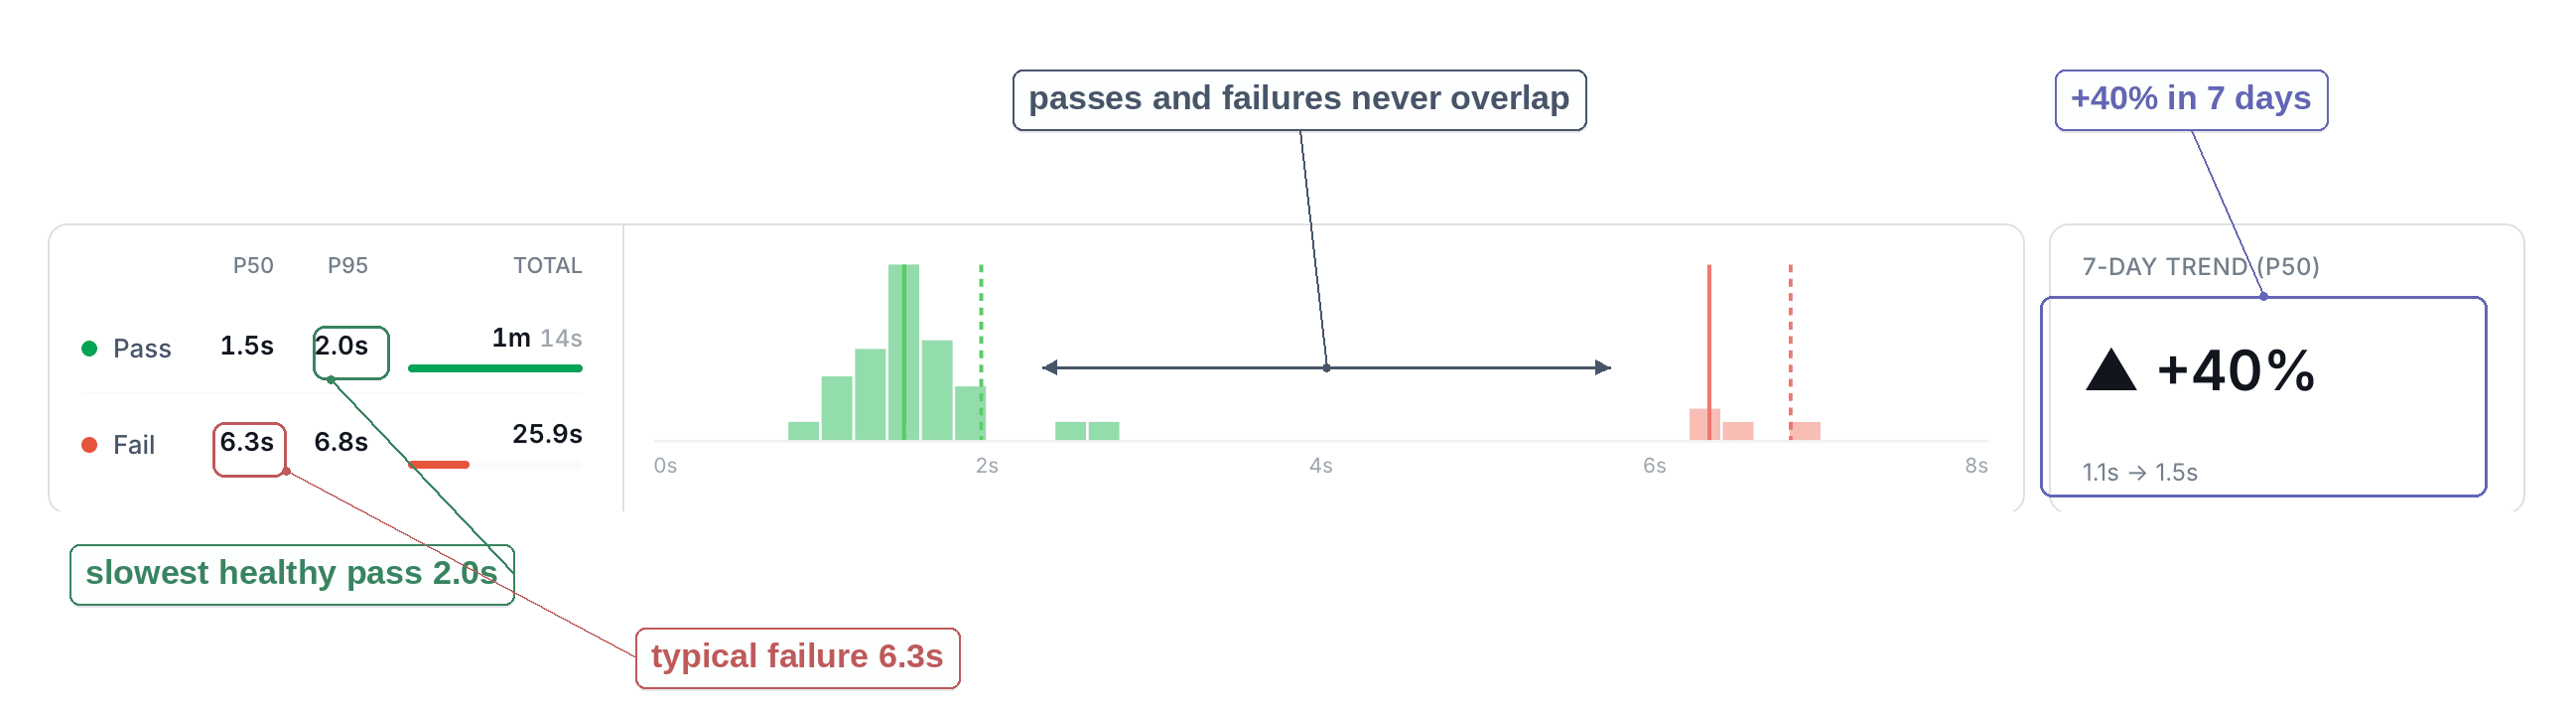
Now look at the timing split on the Performance tab.
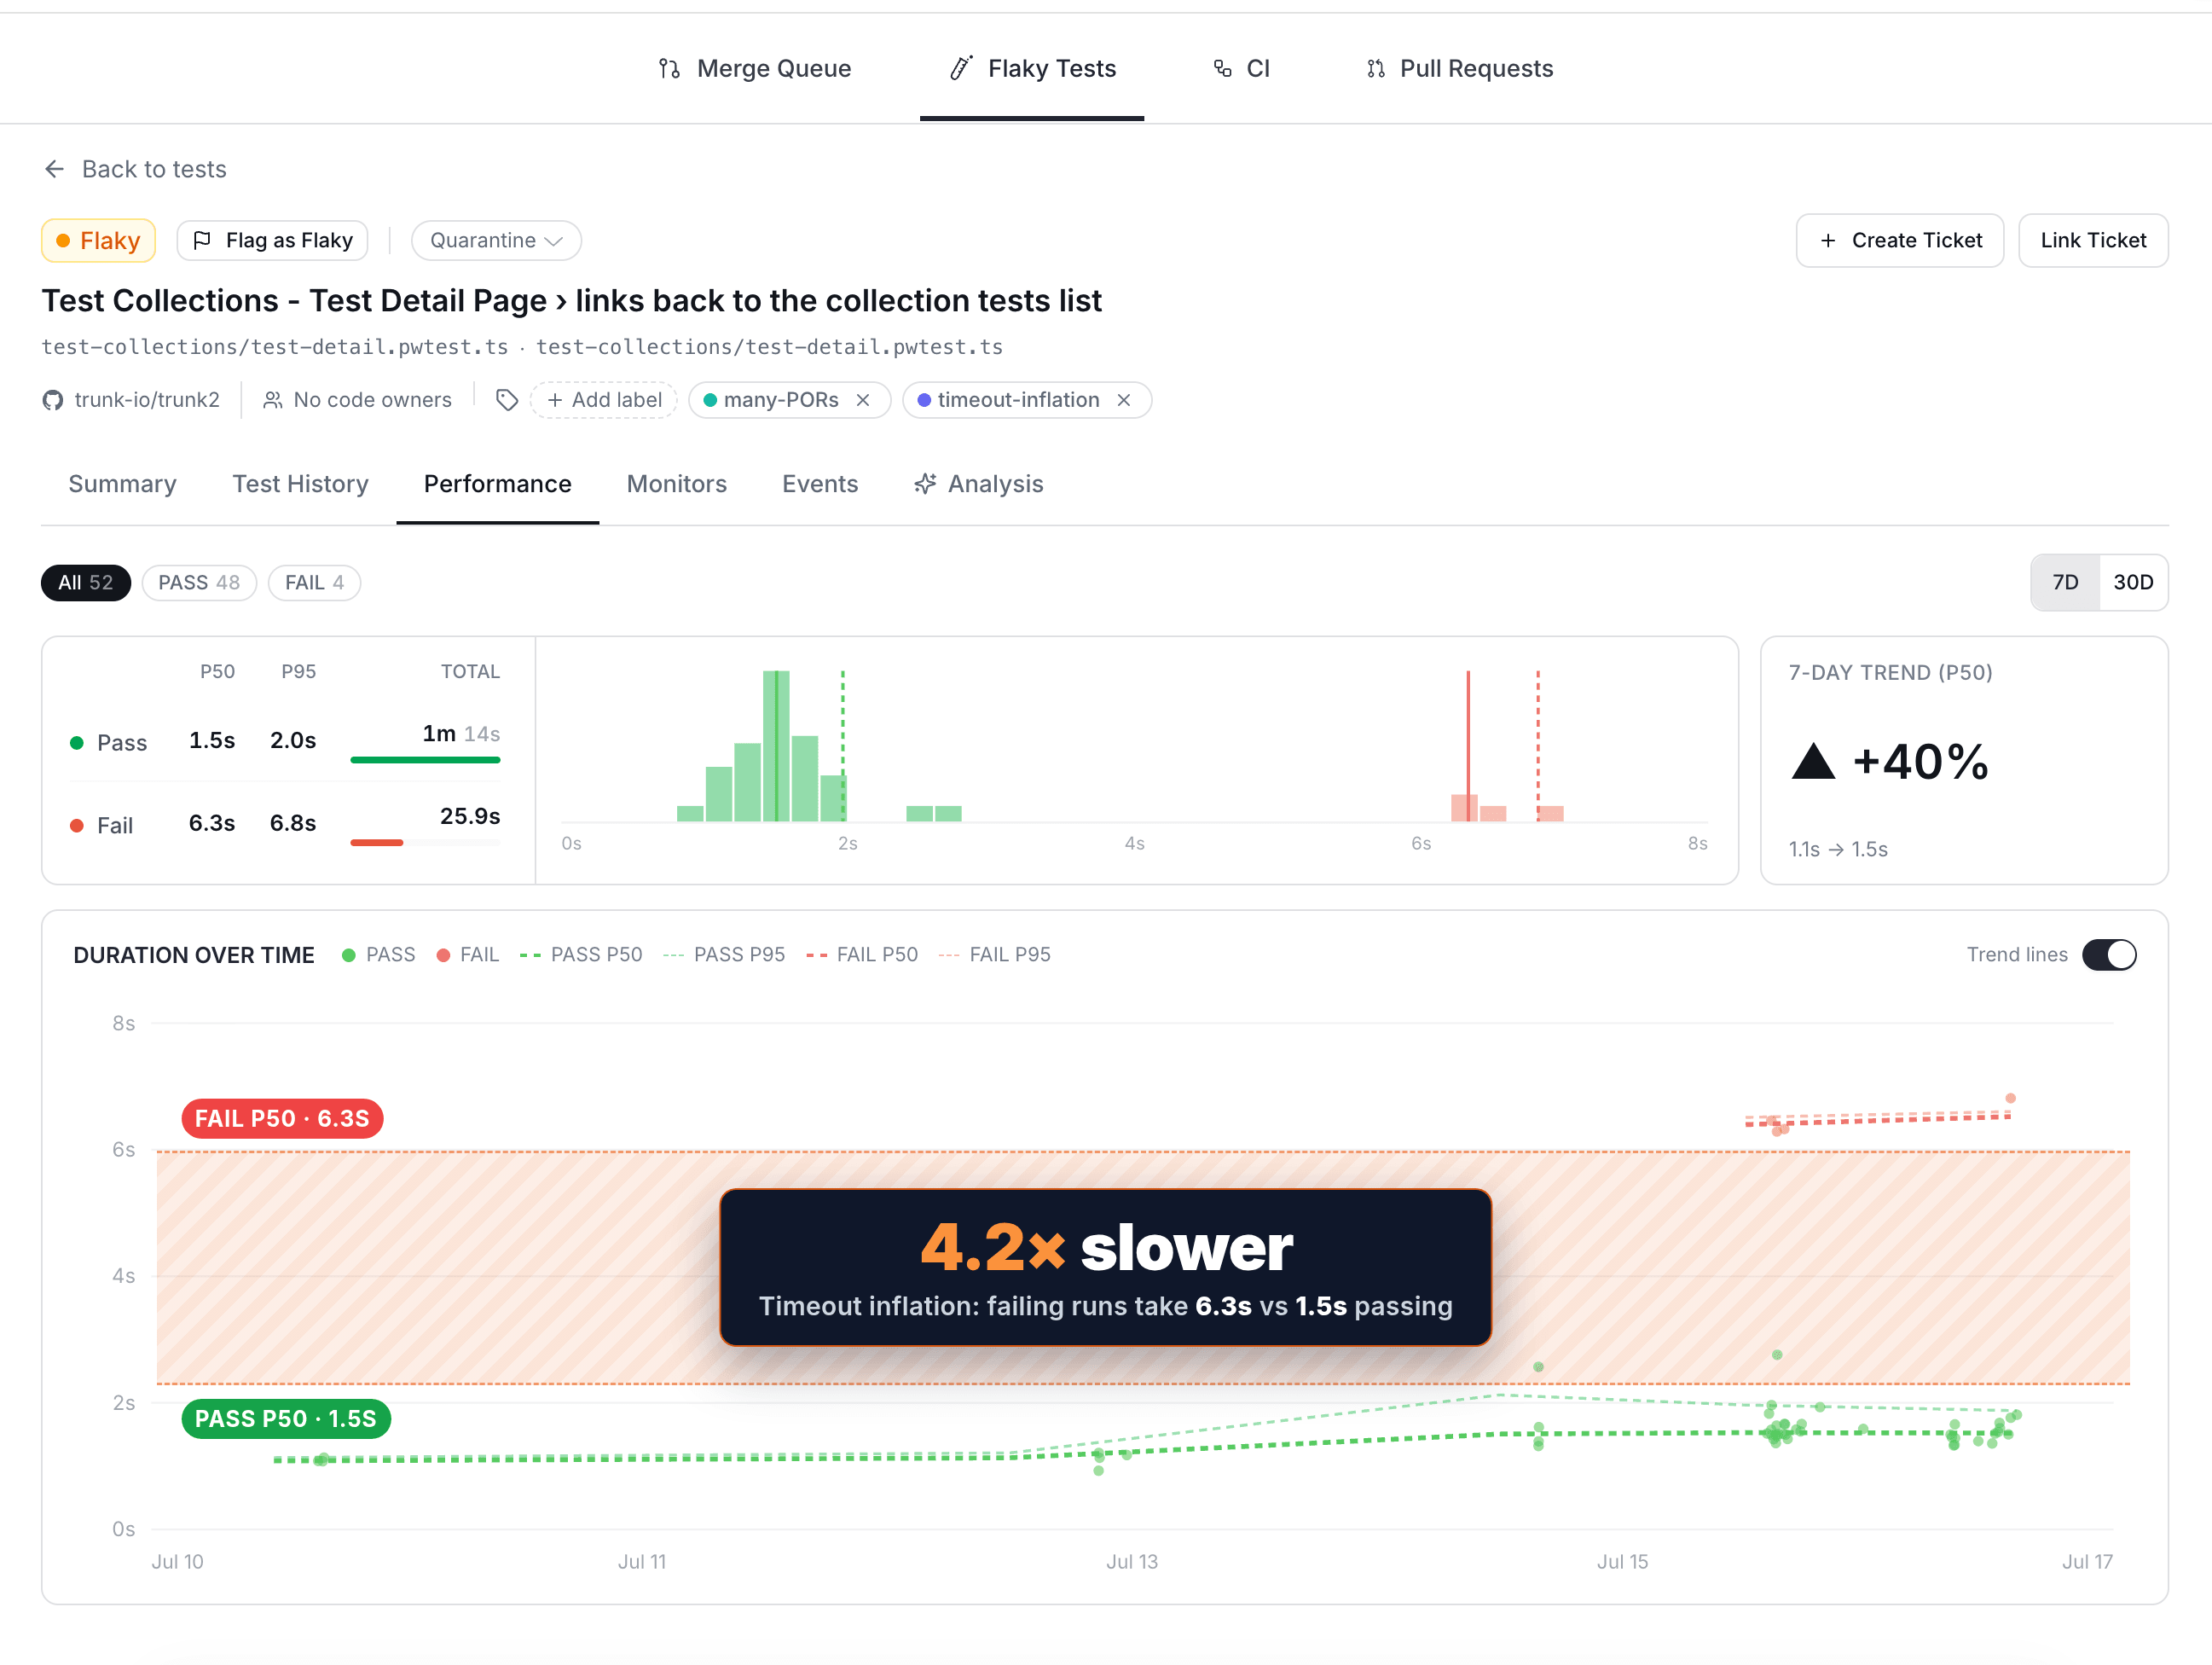
When this test passes, it passes fast: p50 1.5s, p95 2.0s. When it fails, it fails at p50 6.3s. Those two distributions don't overlap at all. There's a clean empty gap between the slowest passes and the typical failures, and that gap is the whole tell. The failures aren't slow runs of a working test. They're a broken test sitting on a timeout.
And notice the 7-day P50 trend on the passes: up 40%, from 1.1s to 1.5s. The ratchet isn't a story from the past. It's happening in real time, right in front of us.
This one isn't even a horror story. The gap is about 3x. Out in the wild, on heavier suites, it gets far uglier, the kind of inflation where every broken run costs you a full minute per retry. The worse the inflation, the more the monitor pays for itself.
The knobs
It's not magic, and it's not zero-config. It ships with sensible defaults and exposes the handful of knobs that actually matter.
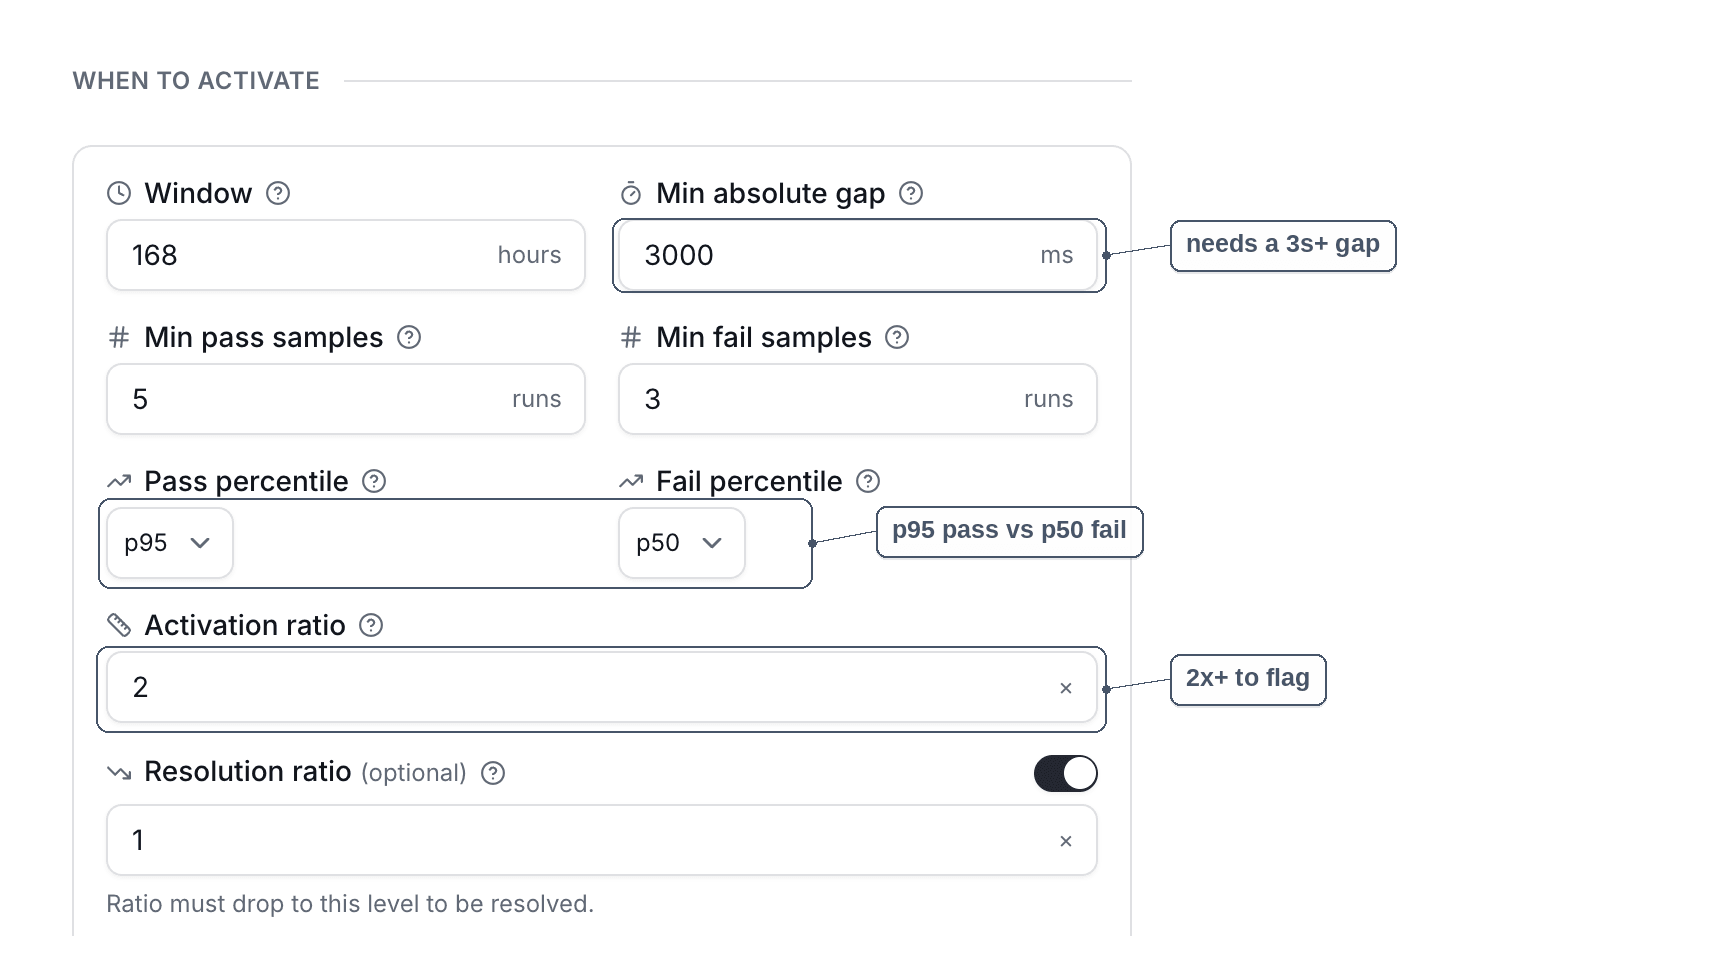
The ones worth understanding:
Pass percentile and fail percentile. We default to p95 for passes and p50 for failures. That's deliberately conservative. We stack your slowest reasonable success against your typical failure, so a single slow outlier can't fool us.
Activation ratio. How many times larger the failure time has to be than the passing time before we flag it. Default is 2x. The real test above is running north of 3x.
Min absolute gap. A floor, defaulted to 3 seconds, so a test that passes in 10ms and fails in 30ms stays quiet. Technically a 3x ratio, practically nobody cares.
Min pass and fail samples. Don't flag on thin data. Defaults are 5 passes and 3 failures inside the window.
Window. How far back we look, defaulted to 168 hours. One week, so the signal tracks recent behavior instead of ancient history.
Resolution ratio. Once you bring a timeout down, the monitor auto-resolves when the ratio drops back to this level. No manual bookkeeping.
What you do about it
Finding the inflated timeouts is most of the battle. Think of it like short-sellers in a market. For years the timeout only had buyers, everyone bidding it higher. Now there's knowledgeable back pressure on the other side, a reason grounded in real data to ratchet those timeouts back down.
Once a test is flagged, the fix is usually to bring the timeout down to something anchored in reality. If a test passes in 2s at p95, it does not need a 60s timeout. Give it 3s. That's 50% more time than it ever needs to finish. Now when it breaks, it fails fast. Your feedback loop goes from three minutes of thumb-twiddling to a few seconds of actual signal. Retries stop being a punishment.
You reclaim the whole point of a test suite, which is to tell you what's wrong as fast as possible.
We shipped it
This started as a side-quest born out of pure annoyance, and it turned into one of my favorite monitors we've built. The Timeout Inflation monitor is live in Trunk now.
If you're running Playwright or any heavy UI automation suite, you almost certainly have inflated timeouts hiding in there right now, quietly taxing every broken build. We already collect the test history that makes this possible through Trunk Test Intelligence, so pointing the monitor at your suite is the easy part. It'll surface the tests where your failure times have drifted far above your passing times, tell you which timeouts have ratcheted up past the point of reason, and give you a list you can actually act on.
Your slowest failures probably aren't slow tests. They're broken timeouts. Come find out how many you've got.